

Stop Complaining About "Bad Polls."
Polling and election forecasting don't have the best reputation for accuracy, but they deserve more credit than they typically get, even if they may not be as precise as we want.

On the day of the 2020 Presidential Election, FiveThirtyEight’s presidential forecast gave then former Vice President Joe Biden an 89% chance of winning the Electoral College. They projected him to snag North Carolina by 1.8%, runaway with Florida’s 29 electoral votes by a margin of 2.5%, and brutally defeat Trump in Pennsylvania by 4.7%. However, as results slowly poured in over the coming days, it became quite apparent that too much confidence had been placed in FiveThirtyEight’s election model. Donald Trump ended up winning North Carolina by 1.3% (an error of 3.1%), Florida by 3.3% (5.8% error), and losing Pennsylvania by 1.2% (3.5% error). Twitter users could in their eyes blame only one man for their overconfidence in Biden. Nate Silver.
Despite the never ending barrage of hate the FiveThirtyEight founder and ABC News contributor received online, Nate Silver had been more conservative in his forecast than Twitter mobs had convinced themselves. At 1 AM on Election Day, Silver posted his final election update, addressing the fact that the presidential election was a only polling error away from a Biden land-slide or an extremely tight-race. The final election forecast put the most likely electoral college outcome at Biden-351, Trump-187. Noting that presidential election polls in the last couple of elections were off by roughly 3%, Silver wrote that if a national polling error of this magnitude were to occur in Biden’s favor, it would shift his lead in the Electoral College to 413 electoral college votes. If it was in Trump’s favor, Biden’s count would be cut down to 278.
Reality, however, was somewhere in the middle. Biden won the popular vote by around 4.5%, meaning that FiveThirtyEight’s +8% Biden victory was off by little more than 3%. Biden didn’t win 278 electoral college votes though; he won a modest 306. Nate Silver wasn’t right, but he wasn’t wrong either. There was a polling error, and it was tight. While politicos ignored the fact that two days before the election Silver published an article titled “I’m Here To Remind You That Trump Can Still Win,” they weren’t completely at fault for being angry with election forecasters. There were flaws in the FiveThirtyEight election model. There were flaws in the polls. Political pundits were miles off from where they predicted the results to be. But why? Why was everyone so wrong? Because there’s simply no easy way to be precise when predicting elections, but polls and forecasters may be more accurate than we give them credit for. Let me explain.
Many different techniques have been used over the years to determine the voting intentions of Americans. Polling is the most obvious and oldest form, but polling can be inconsistent. Some pollsters are also more reputable than others. That’s why in 2000 RealClearPolitics started averaging election polls in order to more accurately represent where races stood. More intelligent polling aggregates then started to pop up which weighted polls based on their sample sizes and track records. In more recent cycles election forecast models such as FiveThirtyEight’s have gained much popularity due to their combination of both polling and “fundamentals.” Fundamentals are factors that impact elections such as the partisan make-up of states and districts, demographic shifts, and economic data.
Election models and polls are often viewed as being far more superior than the murkiness of political commentary. They are taken more seriously because, unlike political commentators, they are seen as “scientific.” Sadly though, they often fall victim to the negative influences of peer pressure. If a model shows something unexpected, model makers often have the motivation to tweak their models until they receive a more expected outcome. The same is true with polls. When pollsters see that their responses are deviating from those of other prominent pollsters, a phenomenon known as “herding” tends to occur. This is when pollsters adjust their samples in order for their results to line up more with the aggregate. In theory this isn’t necessarily a bad thing. This is normally done with the intention of making such polls more accurate, but often it can cause the opposite, a systemic inaccuracy in polling.
The immense error in polling seen during the 2020 Presidential Election wasn’t the fault of one single pollster, it was the failure of the entire industry. However, some individual pollsters were fairly close to the actual outcome. Emerson and HarrisX were both within half a point of the national popular vote results (Biden+4.5%). However, most other pollsters said Biden would win by 8-11 points. So are these the “best polls,” and the only ones to which we should pay attention? No. Emerson’s last poll in Pennsylvania showed Biden winning by 8 points, which Biden only won by 1.2%. HarrisX had Biden up by 3 points in Florida; Trump won by 3.3%. Pollsters get it right sometimes, while other times they completely miss the mark. Some pollsters have been more precise than others, and polls have good years and bad. The error in polling varies from election to election and is almost entirely unpredictable. In the last two Presidential elections, polling has overstated Democrat support, but in 2012 it overstated Republican support.
It makes a lot of sense then that, due to the uncertainty behind polling, election forecast models are viewed as superior. Most forecast models predict election outcomes through race ratings. Seats are typically rated as Toss-up, Lean, Likely, and Solid, with each rating implying a less-competitive race. If a seat is rated as a “Toss-up,” it means that the forecaster has little to no confidence in calling the seat for either party. “Solid” means that there is virtually no chance that the candidate for whom the race is called does not win. Forecasts can often give a better representation of where an election truly stands rather than often “noisy” polling data.
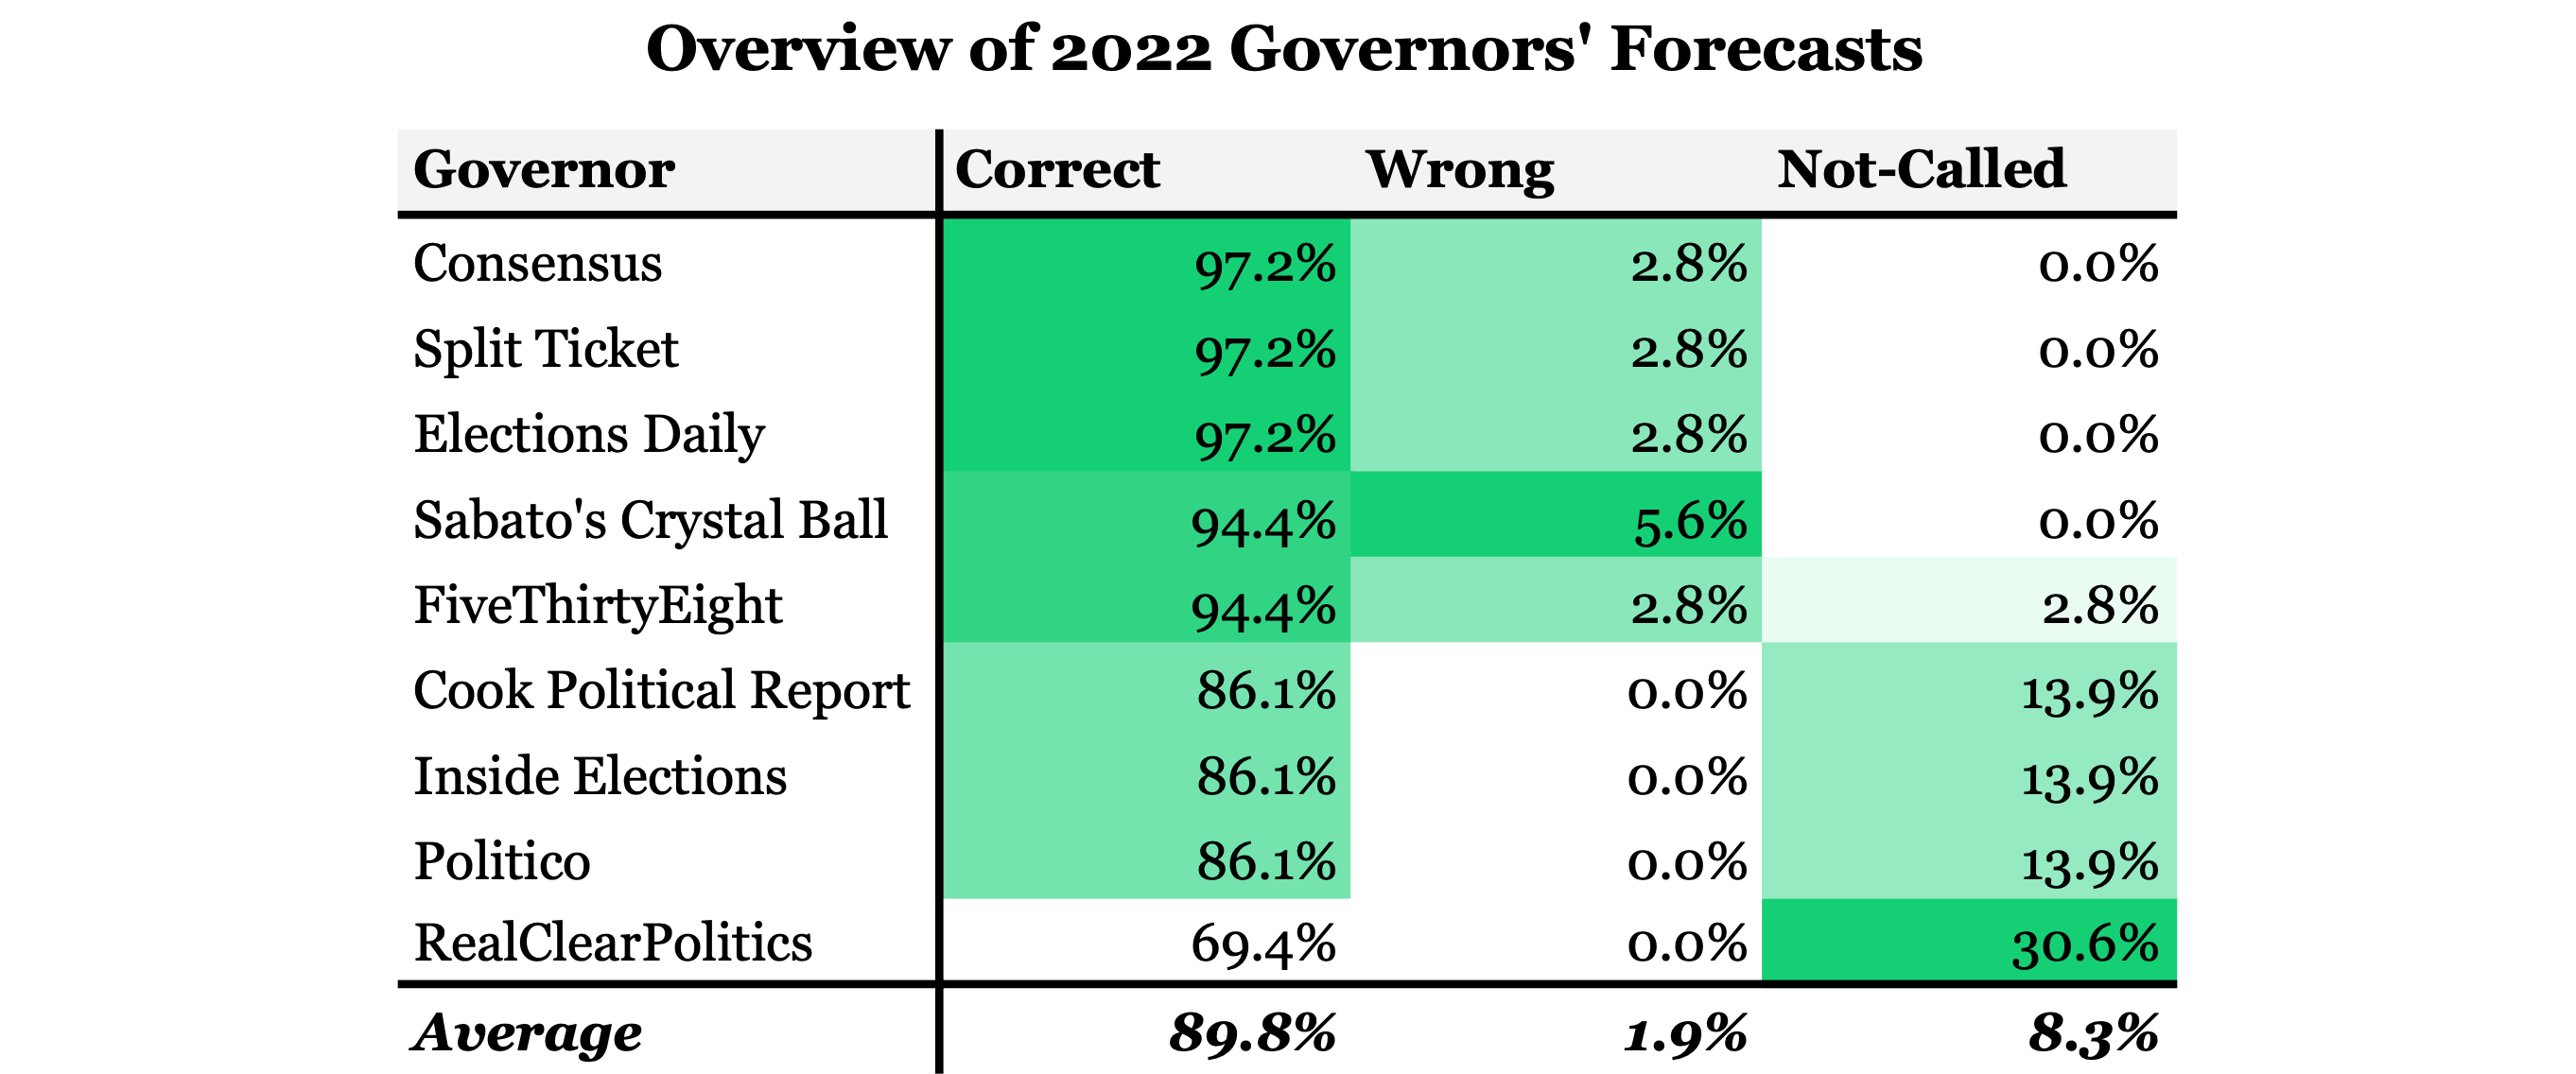
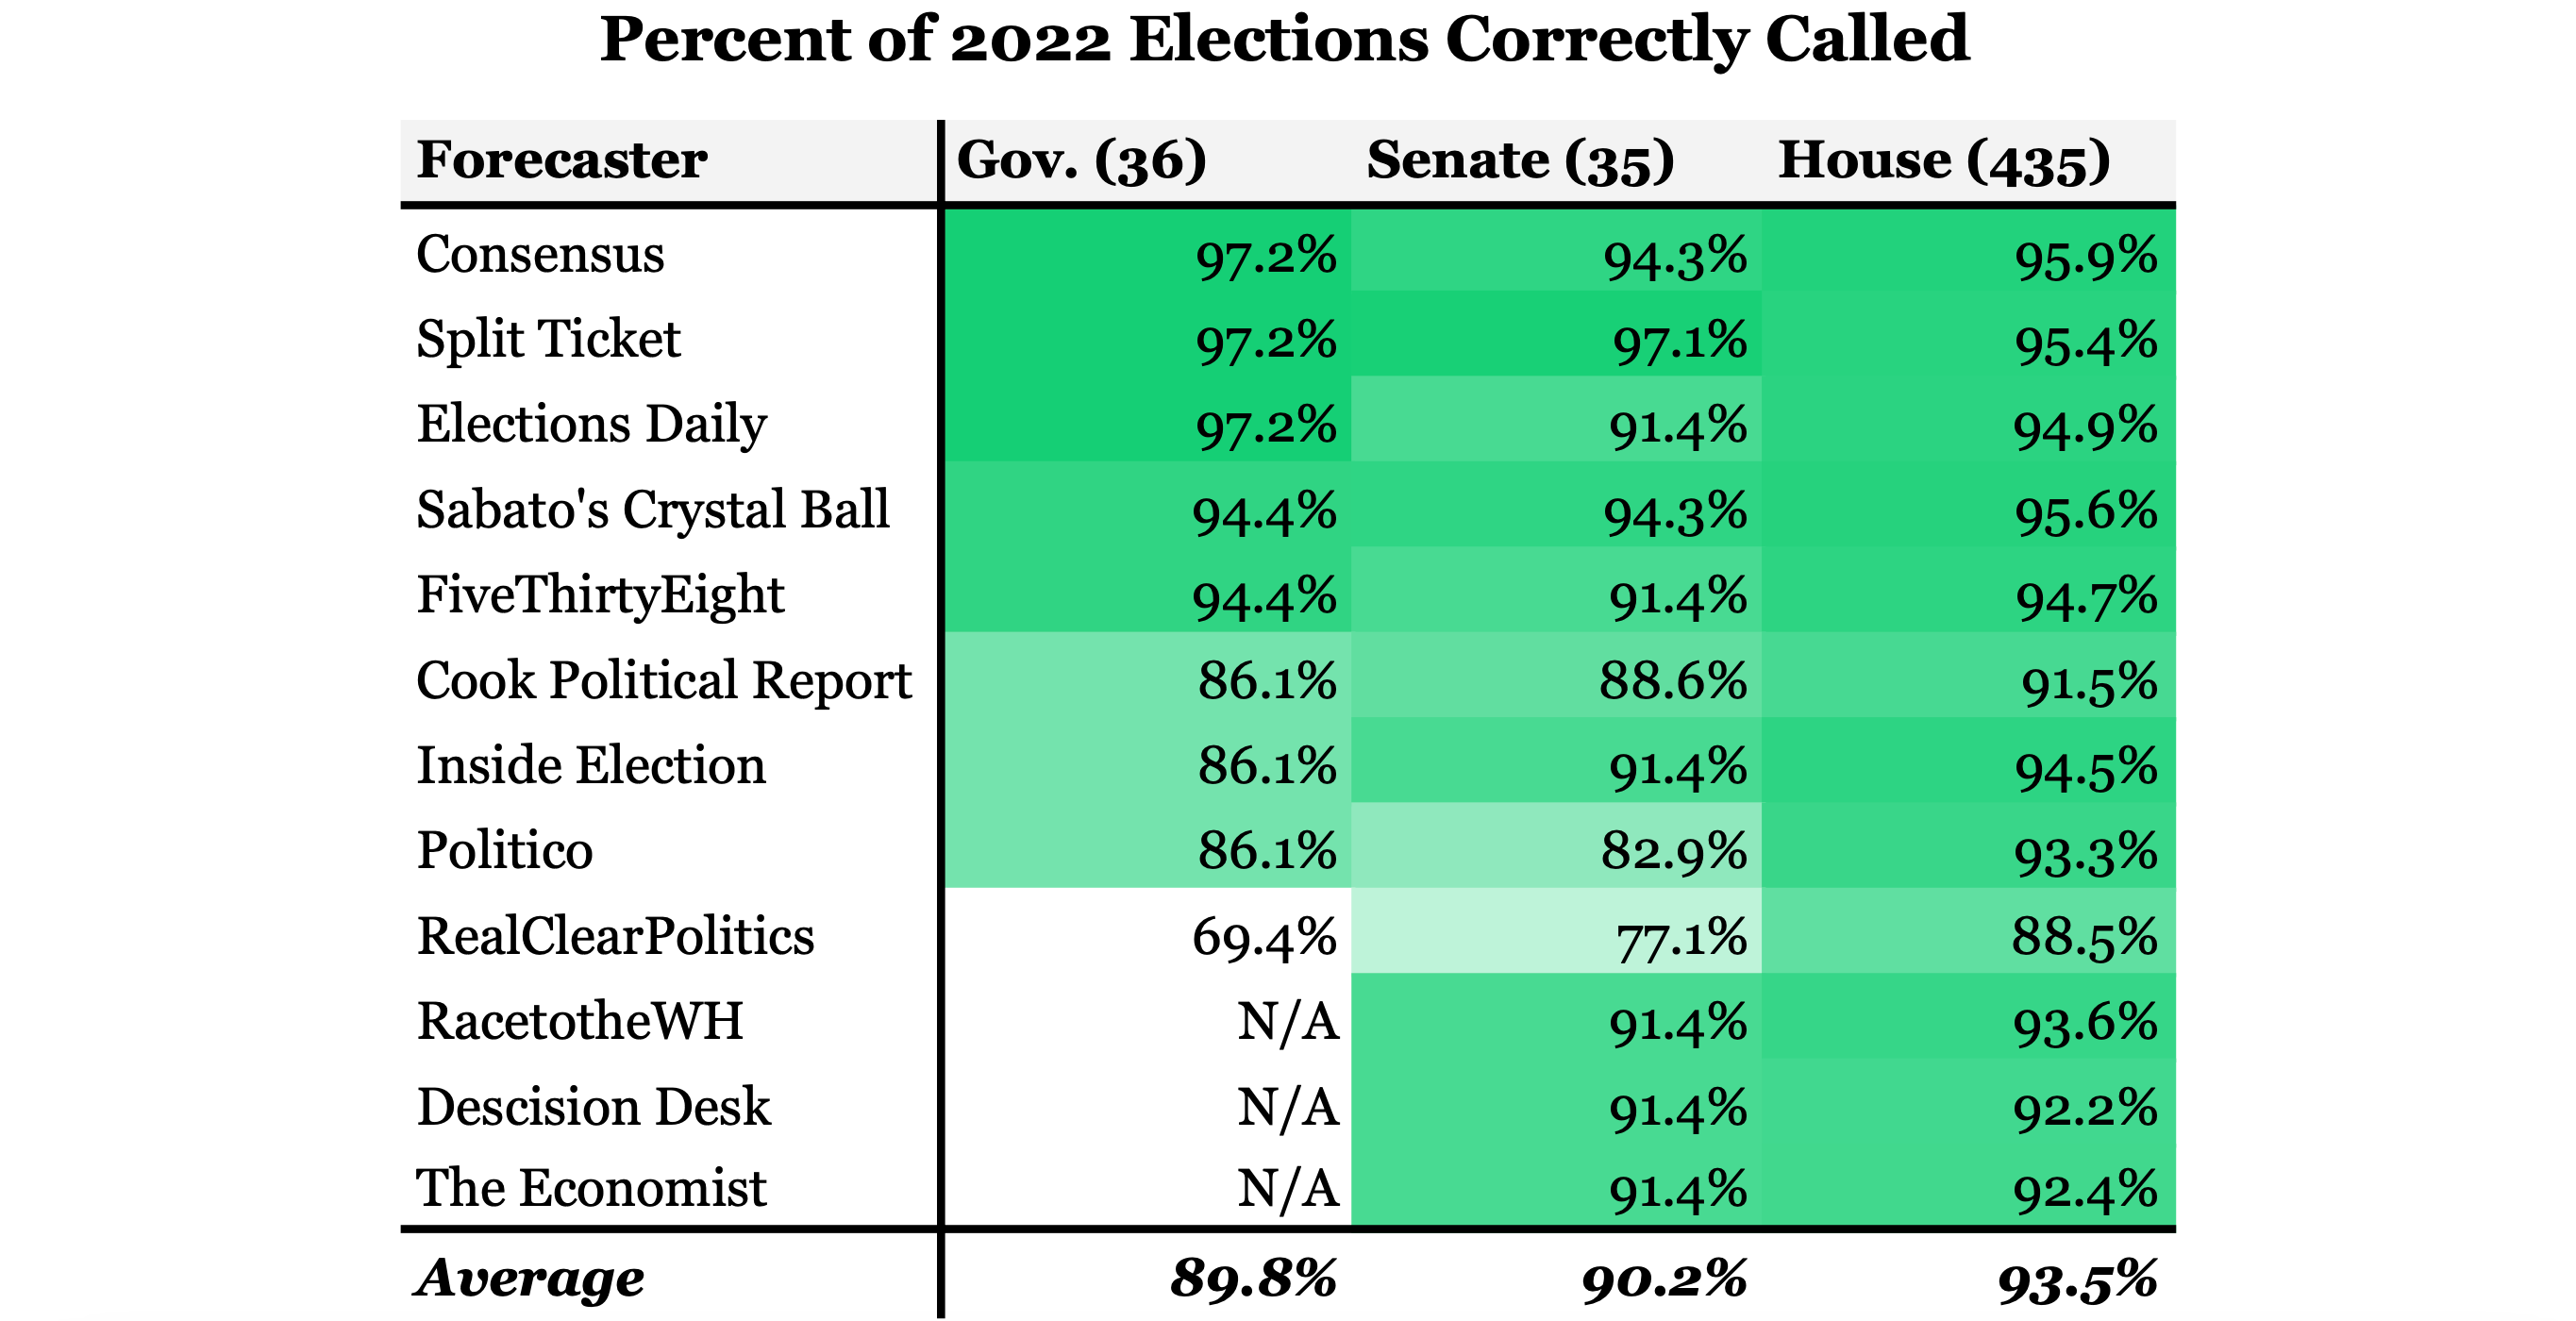
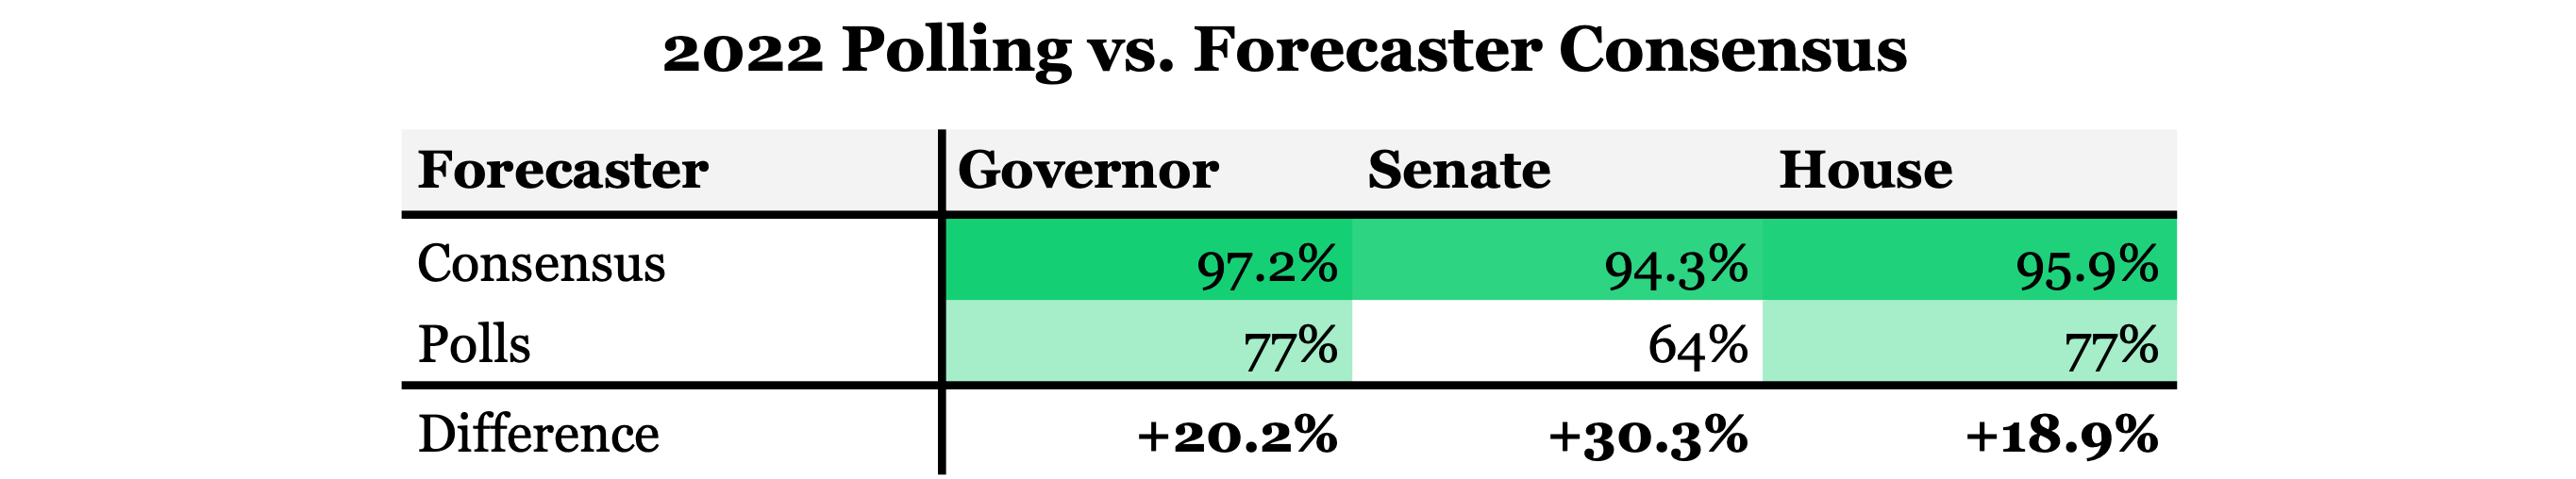
The 2022 election cycle seems to have been a slightly better one for forecasters than 2020. Averaging all prominent forecasters’ seat ratings to get a set of consensus ratings1 shows that forecasters overall only made one wrong call in the Governors’ races. The numbers across the board in congressional elections weren’t all that different. The forecaster consensus correctly called 94.3% of Senate races and 95.9% of House races. Split Ticket leads the pack in overall accuracy, only calling one senate race incorrectly. Sabato’s Crystal Ball called the most House races correctly, but it still called a total of nineteen races for the losing candidate. The numbers overall might seem rather impressive, but that’s really only the case if you ignore the fact that the vast majority of election outcomes are forgone conclusions. Can you really credit someone if they correctly call Nancy Pelosi to win reelection?
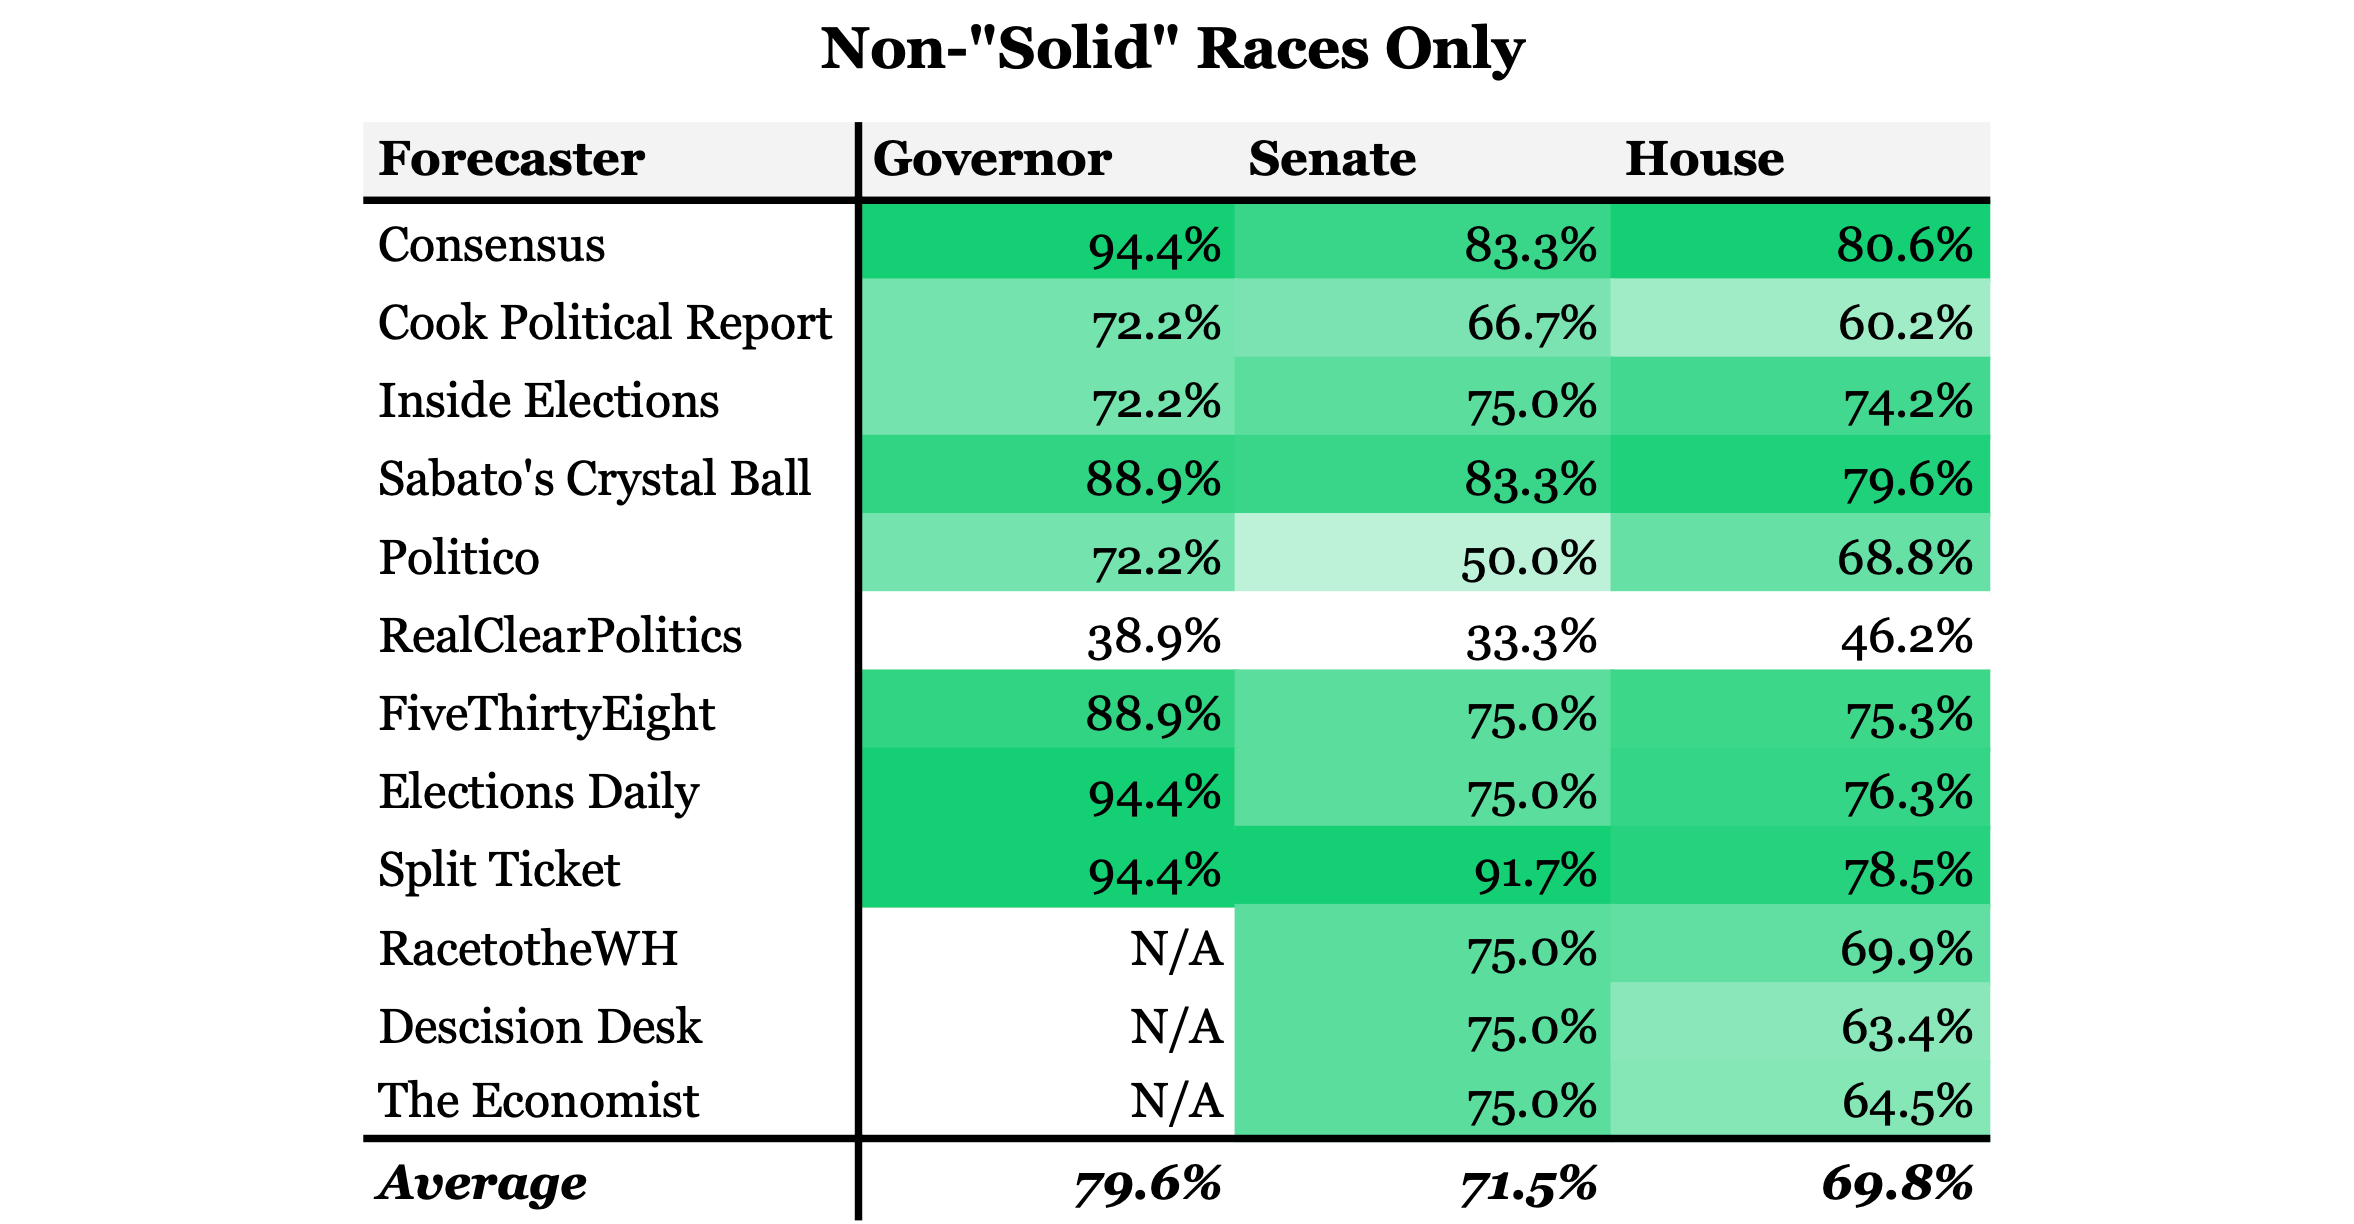
If all consensus Solid Democratic and Republican seats are taken out of the equation only 93 House, 12 Senate, and 18 Gubernatorial races are even potentially competitive. Due to the high accuracy of Senate and Gubernatorial ratings to begin with, there’s very little difference in the percentage of races called correctly. However, the overall accuracy of House ratings’ seems to shrink quite a bit. On average each forecasters called fewer than 70% of the races that were not foregone conclusions. The consensus rating called 80.6% correctly, which is definitely not terrible. Nonetheless, this accuracy score may still be over-inflated, because it still takes into account races in which one candidate does not have a 100% chance of winning, but who is still very likely to win. I’m not trying to down play the accuracy of forecasters, but simply trying to highlight the fact that forecasters lack high accuracy where it matters the most, races in which the outcome is not certain.
We can’t expect forecasters to be perfect, and at the very least they tend to call races more accurately than polling. On average, in 2022, forecasting models called more over 20% more races correctly than polling. It seems that common belief is justified in a having higher degree of confidence in modeling’s accuracy over polling’s. At the same time it cannot be ignored that election models rely heavily on polling. According to FiveThirtyEight, their model relies about half on fundamentals, about eight to nine months before the election, but relies almost entirely on polling by election day. They increase the weight of polls over time because of the belief (and historical reality) that polling becomes more indicative of voting patterns the closer it is to the election. So, if polling is wrong, the final forecast will be wrong, but maybe less so than the polling.
As previously mentioned, polling has good years and bad. 2022 was actually a pretty decent year for polling (at least when compared to the historical numbers). On average, polling was only off by 4.8% compared to being off by 6.3% in 2020 and 6.8% in 2016. Although by margins alone it had higher accuracy, polling actually correctly “predicted” the winner in a combined total of 72% of races. This number is actually below the historical average, since 1998, of 78%. This is the smallest percentage of races “called” correctly by polls since 1998, down from the high of 88% in 2008. This is not to say polling should be abandoned as a form of insight in elections. Of course not. Actually, it seems that too many people think about polling in the completely wrong way. Too much is expected of not only polling but forecasting models. Perfect accuracy is impossible. Pollsters and forecasters always attach doubt and uncertainty into the results they produced, but often people like to turn a blind eye and ignore the details.
At the end of the day there’s a sad fact that needs to be admitted when it comes to polling, modeling, and election “predictions” in general. Sometimes people just don’t read the fine print, often incorrectly inferring a higher degree of confidence in forecasts than forecasters are intending. FiveThirtyEight is quite explicit in what their race ratings mean. They attach an implied probability behind each one of their ratings. When they label a race as “Lean R” it means that the Republican candidate has 60% or greater chance of winning the race. Some people may see that number and think that the odds are heavily in the Republican’s favor, but that’s not reality. What a 60% probability means is that when FiveThirtyEight has simulated election results the Republican candidate has won about 60% of the time. That still means the Democrat candidate won the other 40% of the time. In fact, looking at FiveThirtyEight’s historic track record, when they’ve given a candidate a 40% chance of winning a race, they do in fact win about 40% of the time. That’s shockingly impressive.
Similar misunderstandings seems to arise with polling as well. Nothing is more ripe for misrepresentation than polling numbers. Two polls for North Carolina’s quite competitive Governor’s race were released last week. One showed Republican Lieutenant Governor Mark Robinson leading Democrat Attorney General Josh Stein by five points. The other had Stein leading Robinson by two points. So is polling “broken” as you may hear some cry? No, there is nothing strange about these two polling results. “Margin of error” is a term you often hear bandied about but most people don’t seem to fully understand what that means. Margin of error is typically calculated by dividing 1 by the square root of the sample size (the number of people surveyed). A margin of error is the range that a candidate’s support would result in if the same poll had been conducted multiple times within the poll’s “confidence interval.” If a poll has a typical confidence error of 95%, that means if the poll was conducted 100 times, 95 of those times the results would fall within the poll’s margin of error.
All of that is just long way to say that the two polls can make perfect sense together when you look at their details. Both of these polls has roughly a 4% margin of error. What this means is that if Robinson is polling at 42% in one poll, the same pollster could expect him to poll with support as low as 38% and as high as 46% if separate polls were conducted during the same time period with the same methodology. This is because polls are in essence estimates of public opinion. Margins of errors are applied to both candidates’ support. So, when you only look at the margin in a poll, the margin of error is double (8% instead of 4%). This means that if a poll is Stein+2%, the margin of error could have also yielded a Robinson+6% or Stein+10% result. Single polls are irrelevant. Any promotion of one single poll done by anyone other than the sponsor of that poll is ignorance at best and intentional propaganda at worst.
Now, to be fair, blame is also heaped on polling aggregates, and this blame isn’t unfounded. In the aggregate, polling has had a rough time recently. Just as when looking at the “range” of a specific poll (the margin of error), attention should be paid to the range of a polling aggregate. The range is the span from the “lowest” data point to the “highest” data point. The range of RealClearPolitics’ 2020 Presidential Election final polling average was from Biden+1 to Biden+11 (a ten point range). Yes, the majority of those polls were closer towards an eleven point margin of victory, and the average of those polls was Biden+7.2%. However, the final results of the election (Biden+4.5%) still fell within the range of the polling average. The 2016 polling average had a similar range, from Clinton+6 to Trump+3 (nine points), and Clinton won the popular vote by 2.1%.
Currently, the 2024 Presidential Election polling average has a range from Trump+8 to Biden +2 (ten points). Modern presidential polling history almost guarantees us that if the election were held today the outcome would fall within this range. The average has Trump up by 1.7%, but we have no right to be shocked if the outcome is not that. The data we have in front of us clearly shows us that a range of results are clearly possible. People don’t like that, though. When the 2024 election results likely fall a few points above or below the polling average, once again fingers will point and blame the “bad polls.” We don’t like uncertainty. We prefer precision, but often precision isn’t possible. Does the weatherman tell you whether it will rain or not? No, he gives you probability. “There’s a 60% chance of rain.” When he says there is only a 20% chance of inclement weather you’ll still blame him for being wrong when your beach trip gets rained out. He told you there was a 20% chance of that. You just didn’t listen. The polls said there was chance 2020 would be a close race. We just didn’t listen.
Uncertainty is a fact of life. It’s unavoidable. Though polling and forecasting models clearly lack precision when it comes to predicting tight races, they deserve more credit than we give them. Stop complaining about how “bad” polling is, and accept the fact that perfect precision is simply impossible. Upset elections or surprising margins are never truly unexpected. Typically such outcomes were always possible even if a low probability was associated with them. Stop viewing polling and forecasts as definitive predictions of one clear outcome. Polling averages will probably be wrong more often than not by a couple of percentage points. Forecasts will never get every race right. That does not mean they’re worthless. Polling and modeling provide clear insights into the potential outcomes of elections even if they may not be precise. Ask yourself this, would you rather plan a beach trip ignorant as to what the weather may be that day, or make your plans knowing there’s a 60% chance that it might rain? Exactly.
If you’re interested in seeing the full data set that I used to compile these numbers, send me a message.